Broman KW, Sen Ś, Owens SE, Manichaikul A, Southard-Smith EM,
Churchill GA (2006) The X chromosome in quantitative trait locus
mapping. Genetics 174:2151-2158
![]()
![]()
![]()
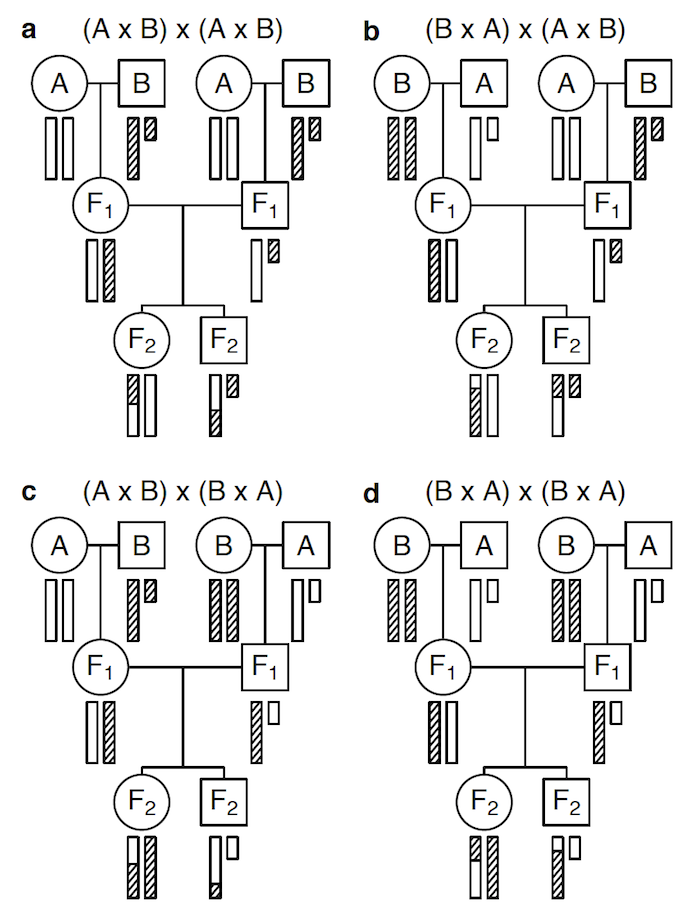
Figure 2. — The behavior of the X chromosome in an intercross. Circles and squares correspond to females and males, respectively. Open and hatched bars correspond to DNA from strains A and B, respectively. The small bar is the Y chromosome.