Broman KW (2014) Fourteen years of R/qtl: Just
barely sustainable. J Open Res Softw
2(1):e11
![]()
![]()
![]()
![]()
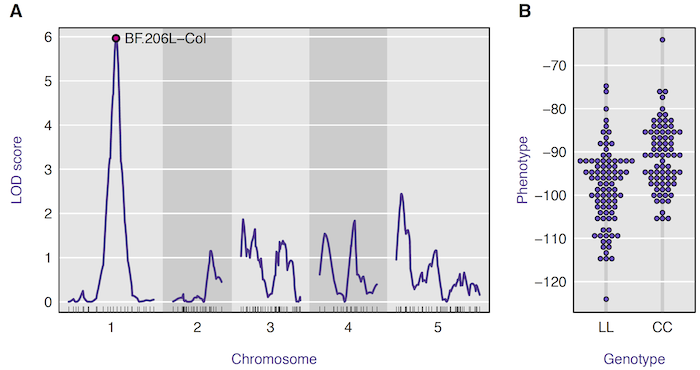
Figure 1. — Typical analysis results from R/qtl. A: LOD curves across the genome, measuring association between phenotype and genotype, and B: Association between genotype and phenotype at the marker with the strongest association. The data are from Moore et al. (2013); panel B was created using the R package beeswarm.