Broman KW, Kim S, Sen Ś, Ané C, Payseur BA (2012) Mapping
quantitative trait loci onto a phylogenetic tree. Genetics
192:267-279
![]()
![]()
![]()
![]()
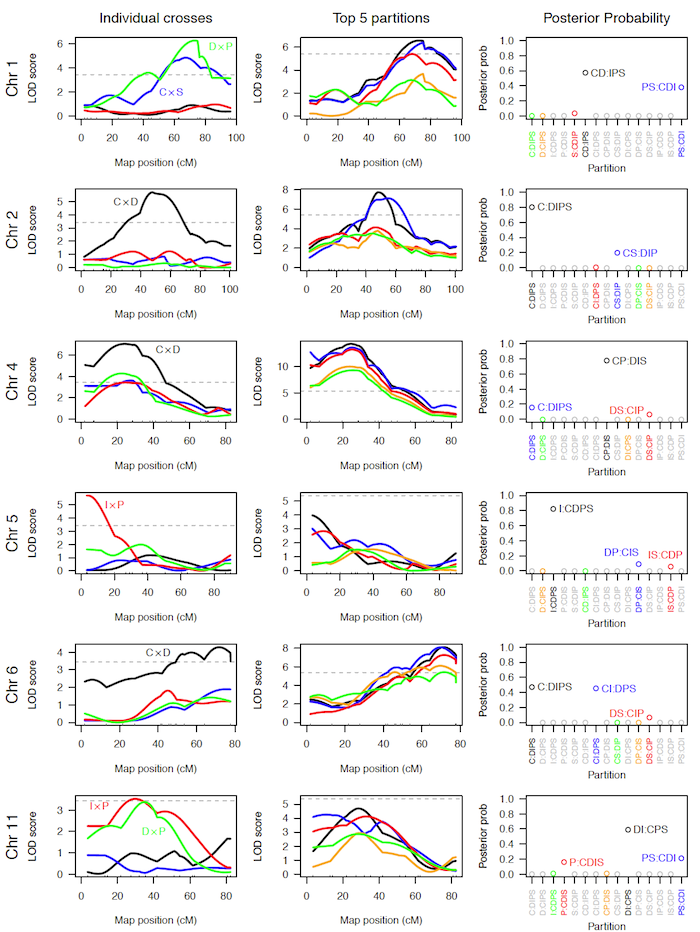
Figure 6. — Analysis results for selected chromosomes for the data from Li et al. (2005): LOD curves for individual crosses (left), LOD curves for the top five partitions (middle), and approximate posterior probabilities for each partition (right). The partitions corresponding to the five LOD curves in the middle are indicated on the right. The labeled points on the right indicate the partitions included in the 95% Bayesian credible sets. On the left and in the middle, dashed horizontal lines are plotted at the 5% significance thresholds.