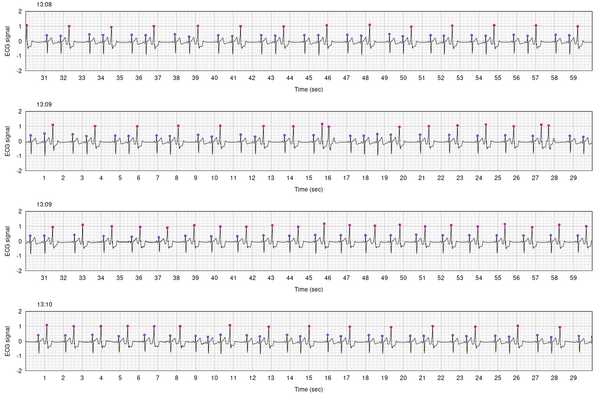
Following up on my post about my heart arrhythmia, and my post about my current covid infection too: yesterday I was wearing my Polar H10 chest strap and watching my PVCs on my Android app, and I noticed very frequent PVCs. My heart seemed to be alternating between bigeminy (every other beat a PVC) and trigeminy (every third beat a PVC). I was also feeling particularly crappy from the covid.
Here’s a two minute example of what my heart was doing, with PVCs marked pink and normal beats marked blue. This has a stretch of trigeminy, a bit of bigeminy, and then back to trigeminy.
Today I’m feeling better, and so I thought I’d take the ECG data from yesterday and identify stretches of bigeminy, trigeminy, or normal (“sinus rhythm”, with no PVCs). I had data just from about 11:45am to 8:30pm, and I compared it to some data from back in May, where I had data from 6am to the following 6am.
What I do is turn the heart beats into a string of characters N or P (or O for omitted), and then look for stretches of beats that fit a particular pattern. I used a minimum length of 18 beats, either repeated N, or repeated NP, or repeated NNP.
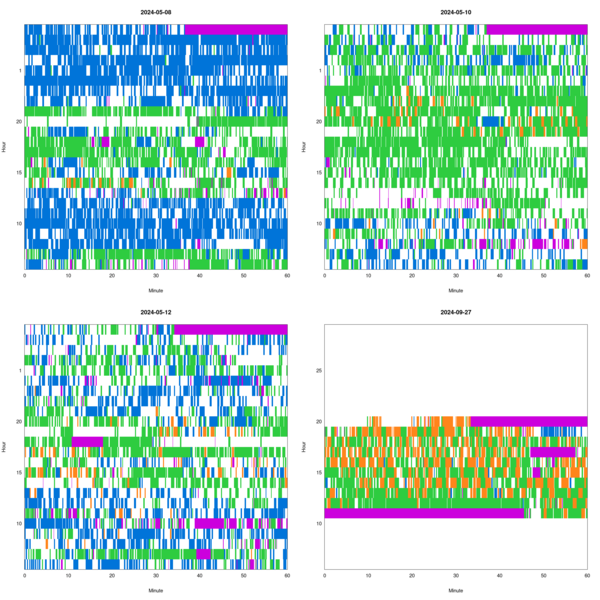
In the following plot, blue is normal sinus rhythm, orange is bigeminy, and green is trigeminy. Purple is omitted data, and white is some other state (except on 2024-09-27 in the lower right, where the patches of white at the top and bottom are missing data). Time is moving from the lower left to the upper right, with each row being a single hour.
Wow, each day is really different.
Yesterday (lower-right) I did have a lot of bigeminy (in orange), alternately with trigeminy (in green). I wish I’d measured the full 24 hours.
The first day here, 2024-05-08 (upper left), has a lot of normal rhythm, but a big chunk of trigeminy. The next day, 2024-05-10 (upper right), is almost entirely trigeminy. The third day, 2024-05-12 (lower left), is more like the first day, though with a lot of trigeminy in the times that were previously normal rhythm.

