This is a long story about a personal health issue, but it’s also about programming and data analysis.
PVCs
Early last year, a phlebotomist at the Red Cross (where I was donating platelets), when taking my pulse, observed that my heart was doing a bit of tango: beat-beat-pause-beat-beat-pause.
I had an appointment for a physical the following week, so I asked about it there, and the nurse confirmed the strange pulse rhythm. The doctor ordered an ECG and a bunch of blood work (which was normal except for having low iron, since I’d just donated platelets).
While a typical ECG recording is only for a few seconds, it did catch the odd pattern, which turned out to be premature ventricular complexes (PVCs) (also known as premature ventricular contractions).
Basically, one of the ventricles initiates an extra beat, which happens a bit closer to the regular beat and causes a bit of a pause afterwards. And the extra ventricle contraction happens before it’s been able to fill with blood, so it’s seen on the ECG but not felt in the pulse.
I’ve had no symptoms at all. Many others who have PVCs notice them and may find them disturbing or even painful, but I’ve felt nothing.
Initial diagnostics
So they ordered a 24-hour Holter monitor, a portable ECG to determine the frequency of these aberrant beats. The results indicated that, of the about 100k beats over the 24 hours, nearly 20% were these PVCs.
PVCs are pretty normal. The longer you measure someone’s heart activity, the more likely you’ll see a PVC. But typically you’ll see about 2 PVCs in 24 hours, with the 95th percentile being around 200 (see Marcus 2020). Seeing more than 1000 PVCs is pretty rare, and seeing >10% is often viewed as a problem that should be corrected.
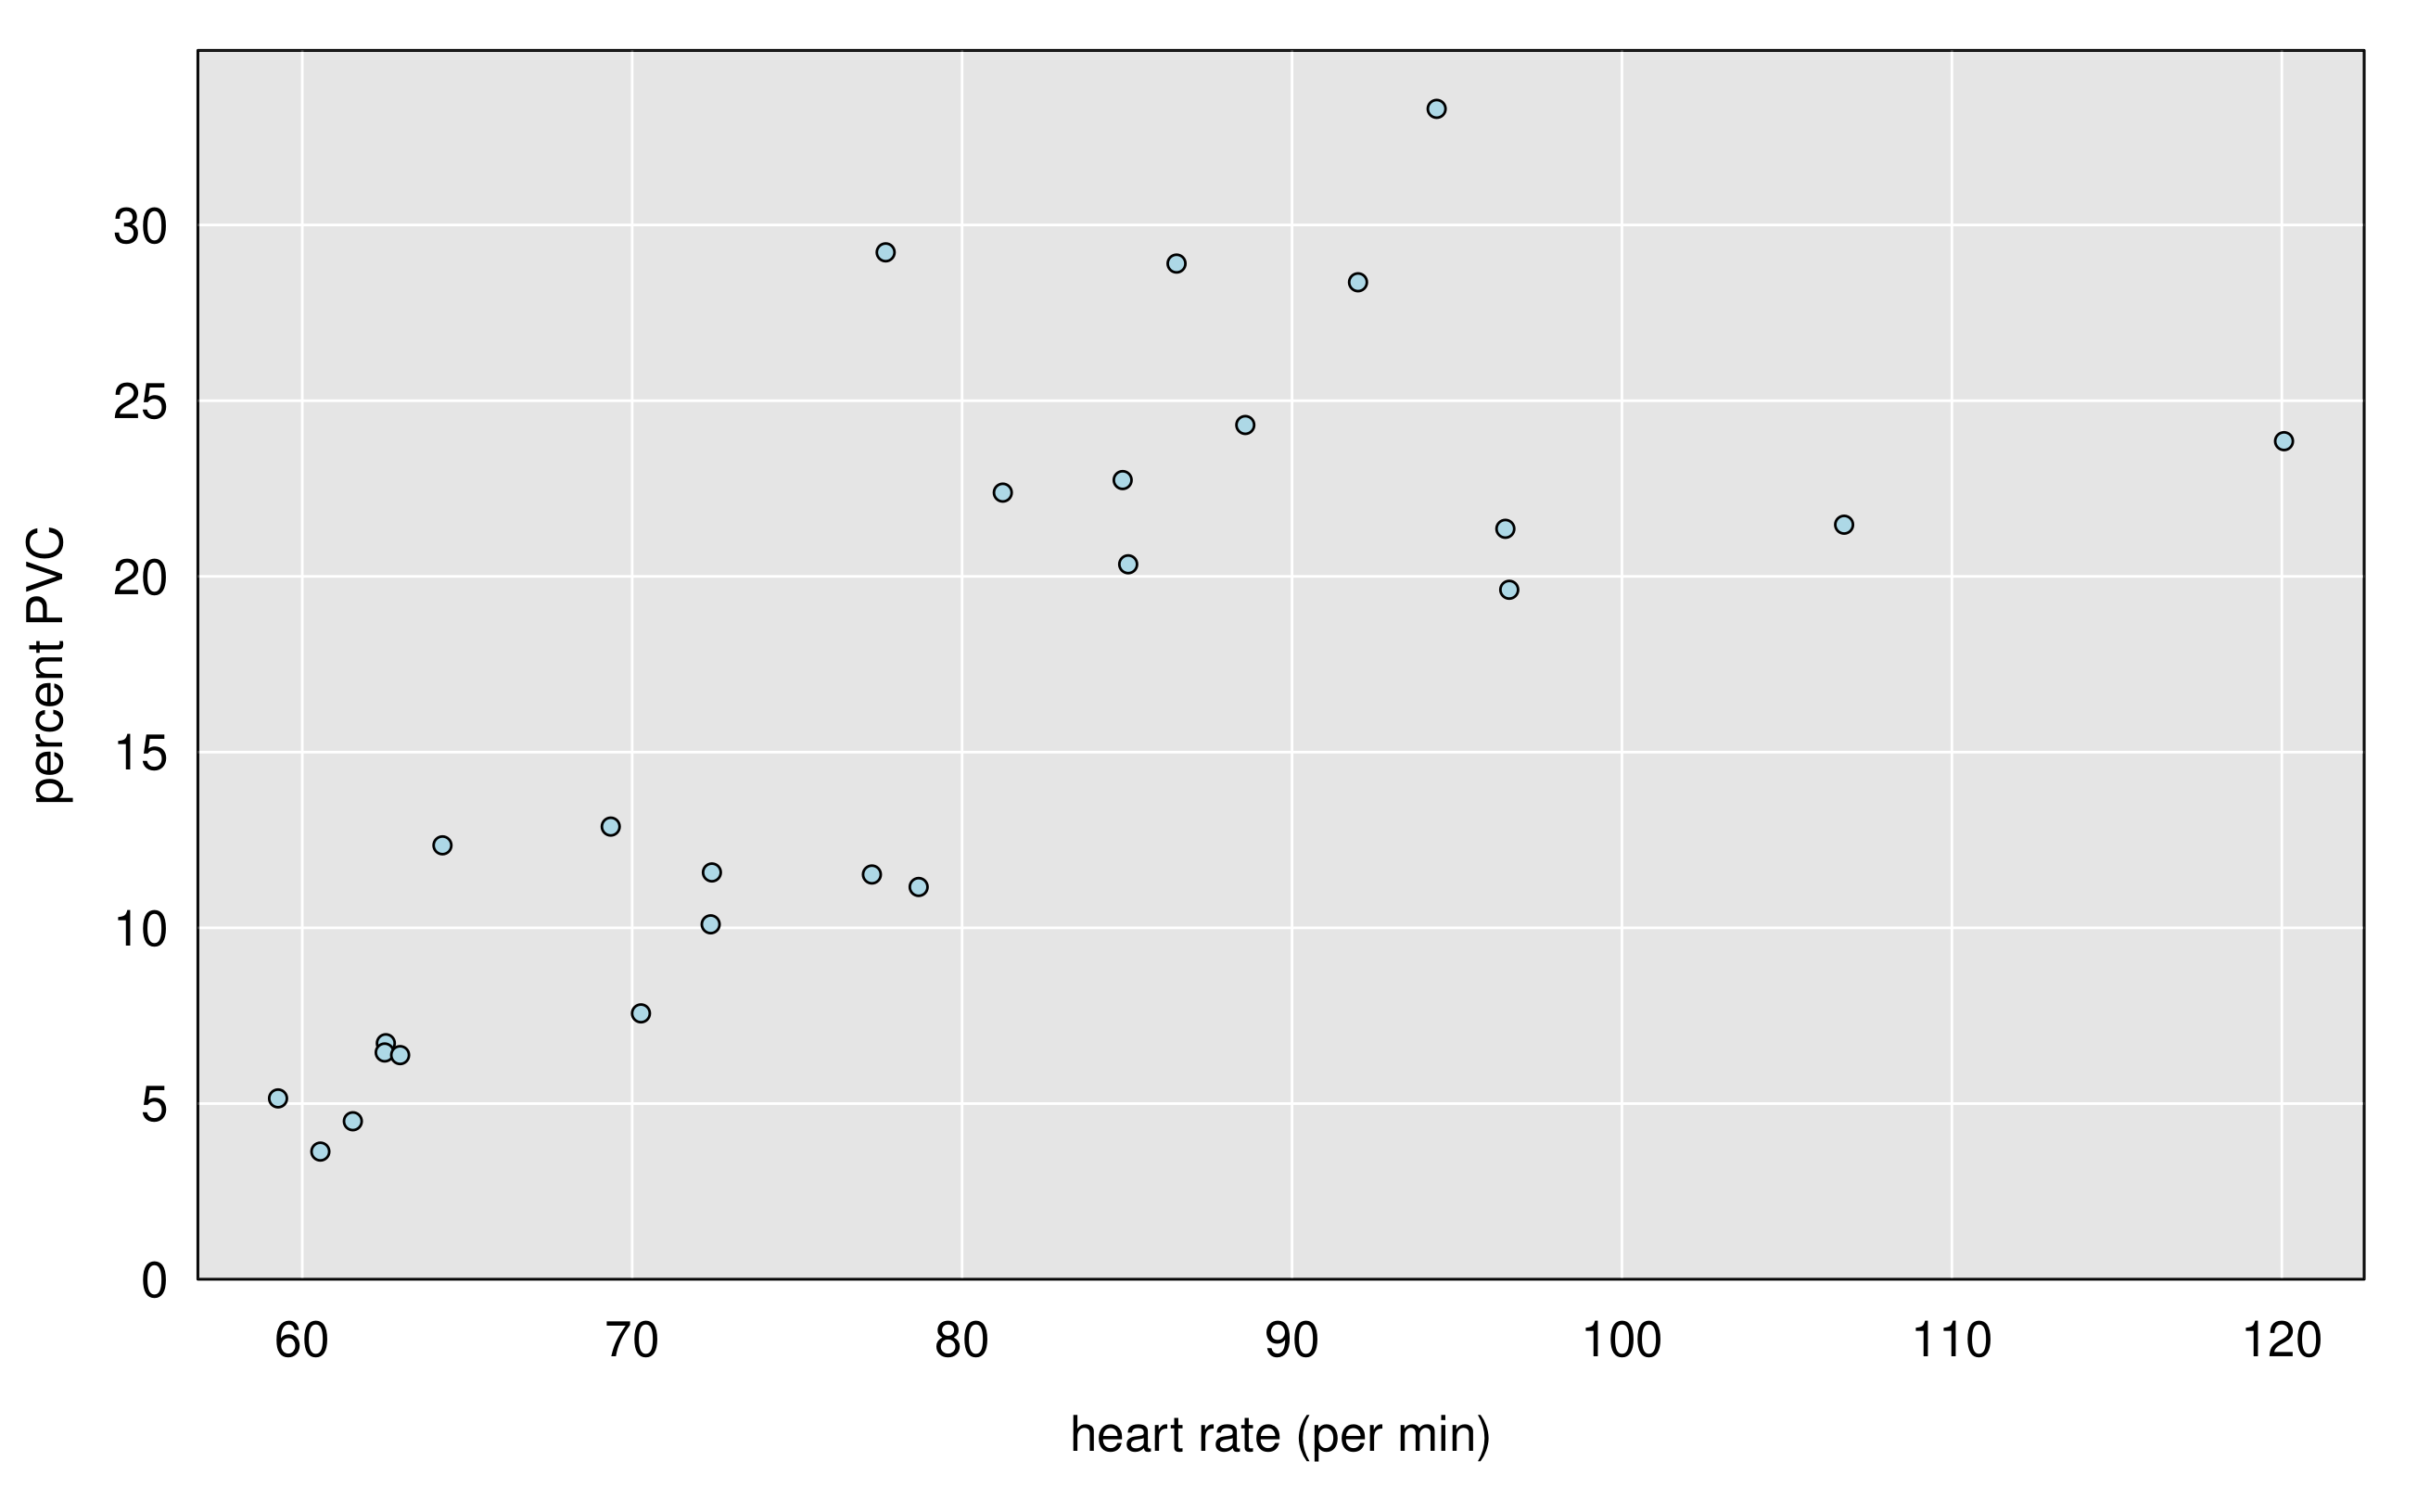
I didn’t get to see much of the data (though it was a pretty detailed, 28-page report), but there was a table with number of beats and PVCs by hour, which showed a clear association with heart rate: the frequency of PVCs is much higher when my heart rate is elevated (that is, when I’m exercising). Here’s a graph, with each dot being one hour during the 24-hour period. When my heart rate was below 80 bpm, the frequency of PVCs was around 10%, while when my heart rate was above 80 bpm, the frequency of PVCs was around 25%.
They had also ordered an echocardiogram, which was scheduled a month later. The echo (ultrasound imaging of the heart) seeks to look for general problems with the heart’s shape and functioning: are things the right size and thickness, are the valves working right, is it pushing out the appropriate amount of blood? Everything looked normal, except for the frequent PVCs which interfered somewhat with the technician’s ability to measure the left ventricular ejection fraction (LVEF), which is a key measure of heart function.
Home ECG
Since I’ve had no symptoms, I looked for ways to be able to measure the PVCs myself. My apple watch has an ECG function, but it is kind of finicky.
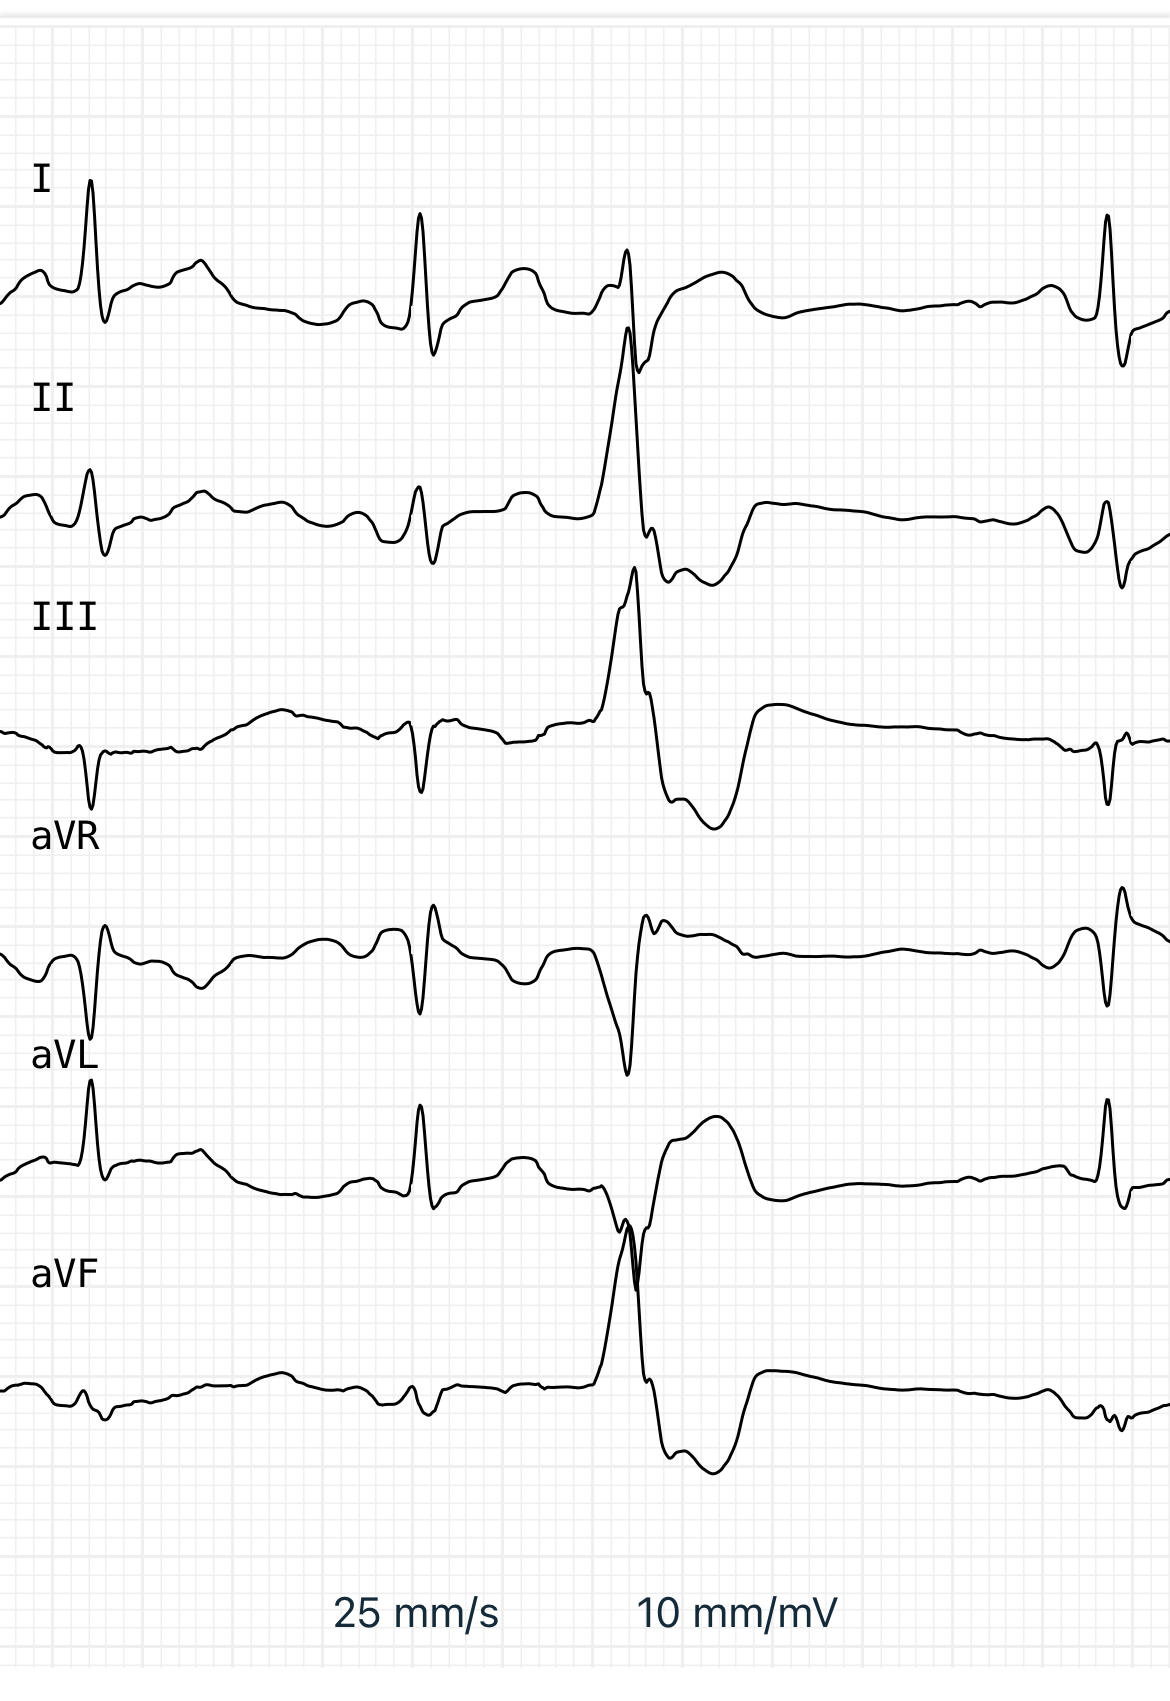
So I purchased a Kardia 6-lead ECG, which is similar to the apple watch in that you have to stop everything and measure the ECG, but it is much easier to use and gives more detail, so the presence of PVCs are very clear.
Here’s a typical image, which shows two normal beats, a PVC, and then another normal beat.
The Kardia measures 30 seconds at a time, and so I spent a some time thinking about study designs to get a good understanding of the overall percent PVCs over the course of a day when you can see just individual 30 second windows. But I didn’t make much progress on that question. The Kardia gives good data so you can see what’s going on in the moment, but it’s hard to see how best to use it to characterize the overall situation.
Use of the Kardia did make clear the association between PVCs and exercise, for me. The frequency of PVCs would generally be low when my heart rate was low but would increase during exercise when my heart rate was elevated.
Temporary cardiologist
A full four months after the echocardiogram, I finally got to see a cardiologist. But it turned out to be a temporary cardiologist. (I asked him how long he’d been in Madison, and he said he actually was semi-retired and lived in Arizona and was just here to help work through the queue at UW Health.) He was very patient and gave good explanations. But that was the one and only time I was to see him.
He said the key thing was to look for potential heart problems that could be the cause of the PVCs. The echocardiogram indicated that there was no enlargement nor problems with heart valves or function, but he ordered two additional tests: a nuclear stress test (which could identify blockages) and a cardiac MRI (which would give a more precise view of heart structure and function). But even if they found no problems, they would probably want to do something to correct the PVCs, either through medication or by an ablation procedure (where they thread a device up through a blood vessel from the groin into the heart, measure the precise location where the PVCs are being initiated, and then burn a tiny bit of tissue at that spot using microwaves).
Further diagnostics
The nuclear stress test was done within a couple of weeks after seeing the cardiologist. They do a CT scan, inject you with some nuclear tracing substance, make you run on a treadmill, and then do the CT scan again. As I understand it, they’re looking for blood vessels that are not getting the tracer, which would indicate a blockage. But it all looked perfectly fine, other than the very high rate of PVCs when exercising.
The cardiac MRI was scheduled for three months later. But then I caught COVID (my first COVID infection) and so it had to be postponed a couple of more months. The cardiac MRI had some difficulties because of the frequent PVCs, but indicated possible reduced function of the left ventricle. (The echocardiogram measured the left ventricle ejection fraction, LVEF, to be 60%. The cardiac MRI measured the LVEF to be 47%. Normal LVEF should be around 50-75%.) The possibly reduced heart function got me an appointment with another cardiologist right away.
New medication
The meeting with this cardiologist was brief. His first suggestion was that I be scheduled to see an electrophysiologist. (It turns out that there are two kinds of cardiologists: plumbers and electricians. I’d seen two plumbers, but I really need an electrician.) But that, of course, would mean another four month delay.
The second suggestion was to change my medication. I’ve been taking the beta blocker atenolol for a number of years, to control blood pressure. It is also supposed to have some effect of reducing arrhythmias, but he recommended switching to a more modern beta blocker, metoprolol.
The new medication had no side effects, but my blood pressure clearly increased, and so they increased the dosage and then increased it again. At that point my blood pressure was back under control, but I saw no effect on the PVCs.
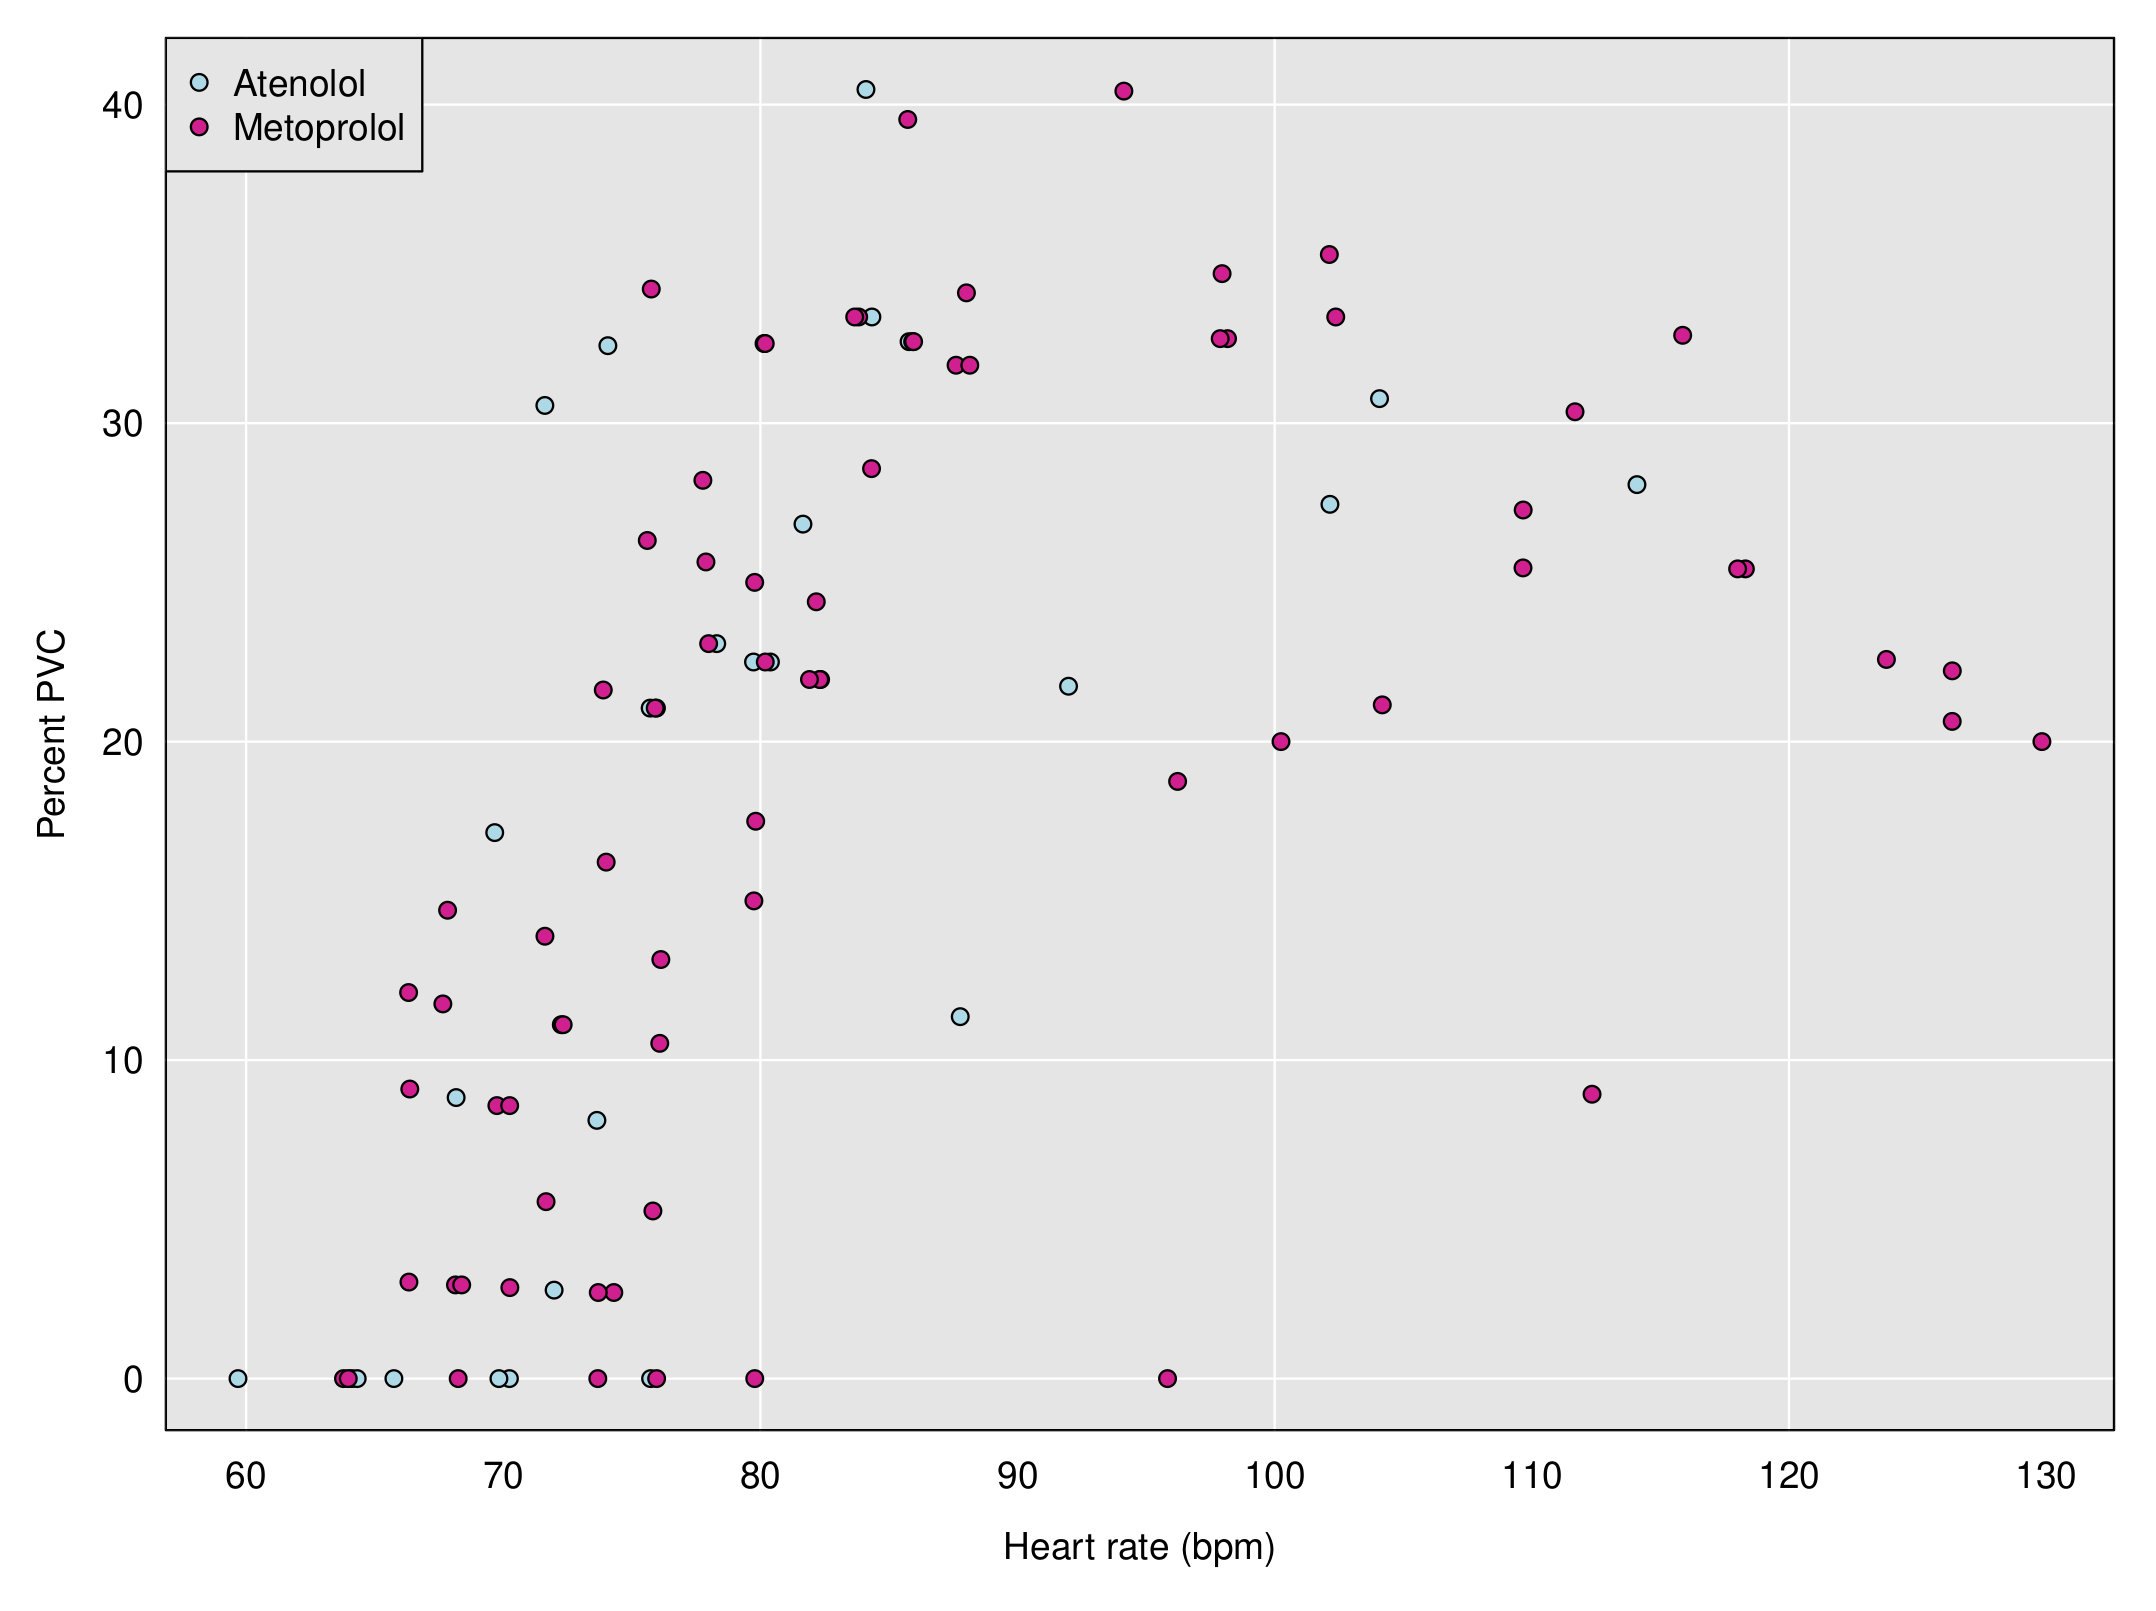
I was trying to use the Kardia device to measure possible changes, but it was tricky, since I could just see 30-second windows. Here is a plot of percent PVC vs heart rate with the two different medications, which shows the relationship between PVCs and heart rate, but no obvious effect of medication. Each dot corresponds to a 30-second window.
The doctor ordered another 24-hour Holter monitor, but it could not be scheduled for >6 weeks.
Polar H10
At this point I was quite frustrated with the waiting. It had been more than a year since the PVCs had been identified, and now I was to wait all summer, to get the official PVC measurements and then to finally see an electrophysiologist. In the meantime, I wanted to find a better way to get continuous data on my PVCs.
After searching for options on the web, I decided to try a Polar H10 chest-strap heart-rate sensor. It costs about $100 and is basically a single-lead ECG with bluetooth. And Polar provides a software development kit (SDK) for iPhones and Android.
There are probably many iPhone apps for the Polar H10, and I picked basically the first one I found, ECG Logger, and paid $7 to enable its data download capability, which made it very easy to save data in CSV files, each containing a one-hour block of time.
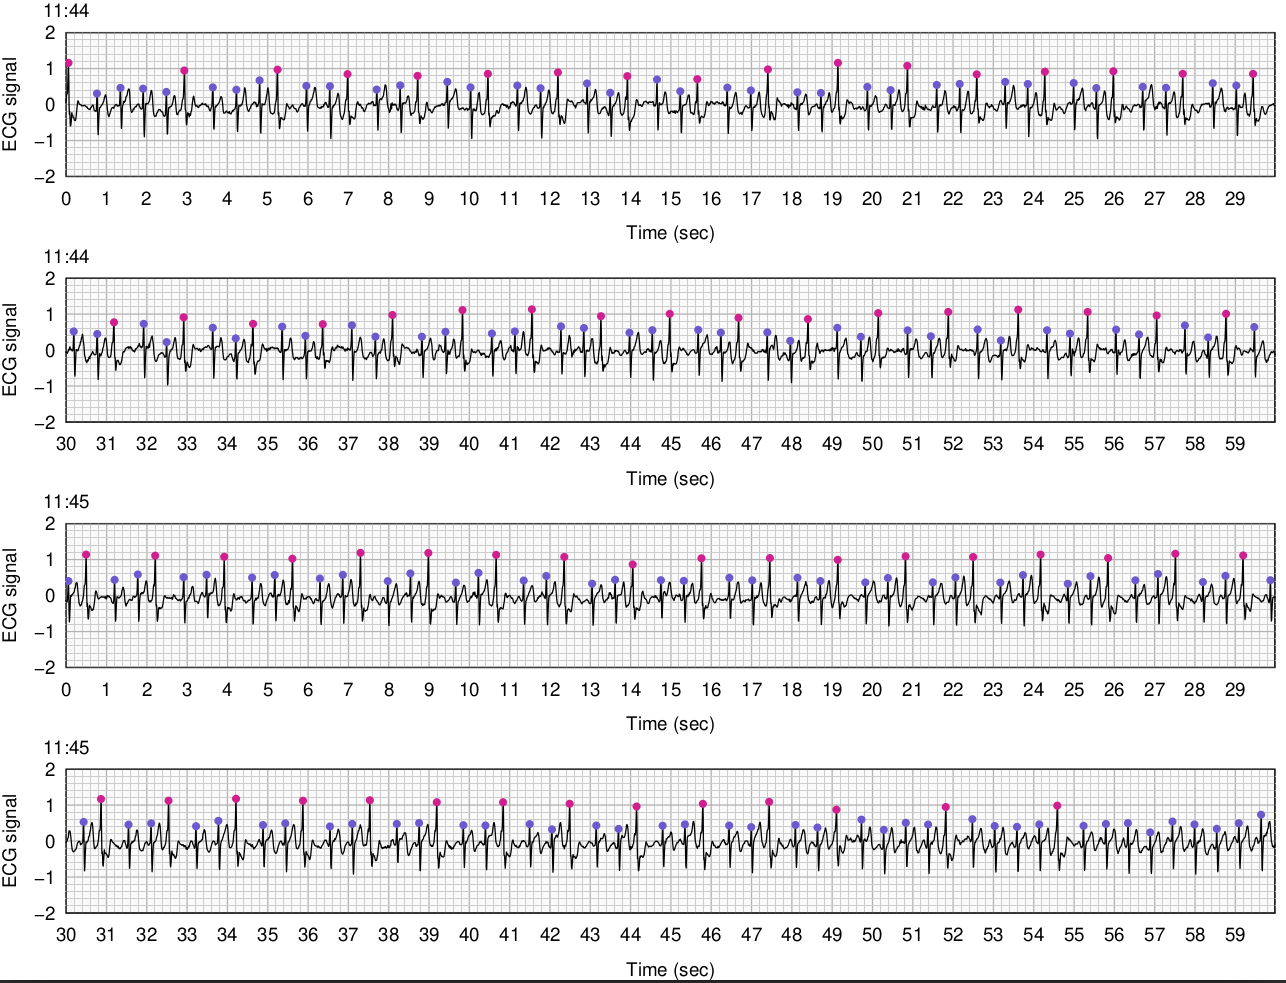
And then I immediately started on an R package, detectPVC, to analyze and graph the data. The main challenges were to identify the peaks, to identify and omit messy intervals from the data, and then to classify the peaks as normal beats vs PVCs. Here’s a stretch of 2 minutes of data, with the peaks labeled with dots (blue is a normal peak and pink is a PVC). This is a long stretch of trigeminy, where every third beat is a PVC, which is a very common pattern for me.
For the peak finding, I used a function in the R package rsleep. (That package has since been removed from CRAN, but it was released under the MIT license, so I just grabbed the code for the one function I was using.) To identify messy intervals, I basically look for signal being > 2 in absolute value or having excessive missing data.
To classify the peaks as normal beats vs PVCs, I calculated various statistics on each peak: relative position between previous and following peaks (usually much closer to previous peak), the height of the peak (tend to be higher), and how quickly it goes from local maximum to the next local minimum (tends to be sooner). I ended up just going with the last of these. I could do more to compare the shape of the peaks, normal vs PVC, but this simple statistic seemed to work sufficiently well for my purposes.
It’s not super comfortable to wear the chest strap constantly, but I did try wearing it for 24 hours, and then wore it every other day for a couple of weeks. Here’s a plot of the running average of PVC percentage over time on nine different days. Note that the last six days are basically 6am to the following day at 6am, while the times for the first three days are a bit different.
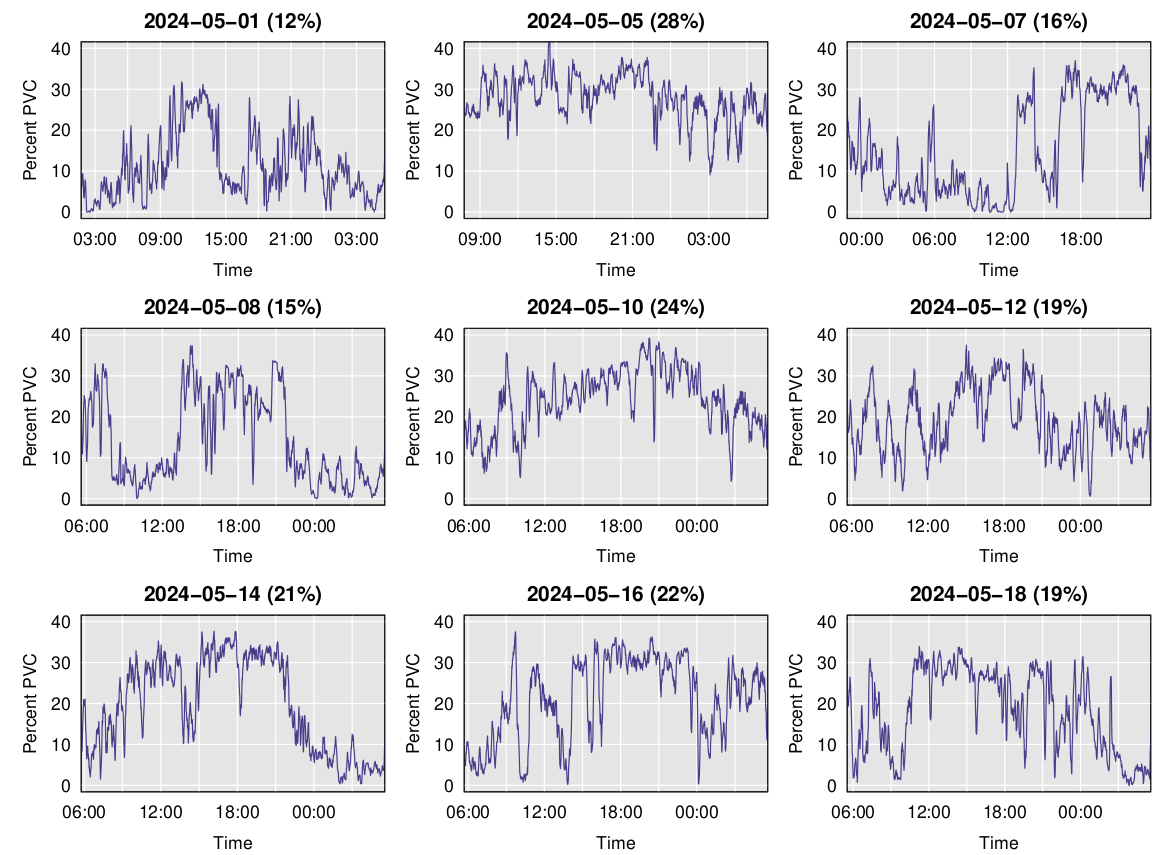
A main feature is the observation I’d had previously: PVCs increase when I’m exercising and go back down when I’m resting (including at night). But there is a lot of day-to-day variation, with the overall percent PVCs being as low as 12% or as high as 28%. Much of this is just an indicator of how much I had been exercising, but there were also days (for example, 2024-05-05) where there was a sustained high rate of PVCs.
I presented some of this data to the cardiologist, basically saying “With this device I can measure the rate of PVCs, and sometimes it’s really high. Can we try a different medication?”
He was not at all interested, and said to just wait until we got the Holter monitor, and until I could see the electrophysiologist.
Android app
The cardiologist wasn’t interested, but I had become super interested. And I really wanted to have a way to look at the PVC percentage in real time. So I started to look at what it would take to make my own app, or to modify someone else’s.
I decided to focus on Android apps, because it seemed much more likely that I would find open source software that I could learn from and build on. So I got myself a Samsung Galaxy phone, got some books on Android app development, and looked for suitable apps on GitHub. Writing an Android app involves Java (or Kotlin, which is sort of “Java improved”) and XML, two of my least favorite things, but so be it.
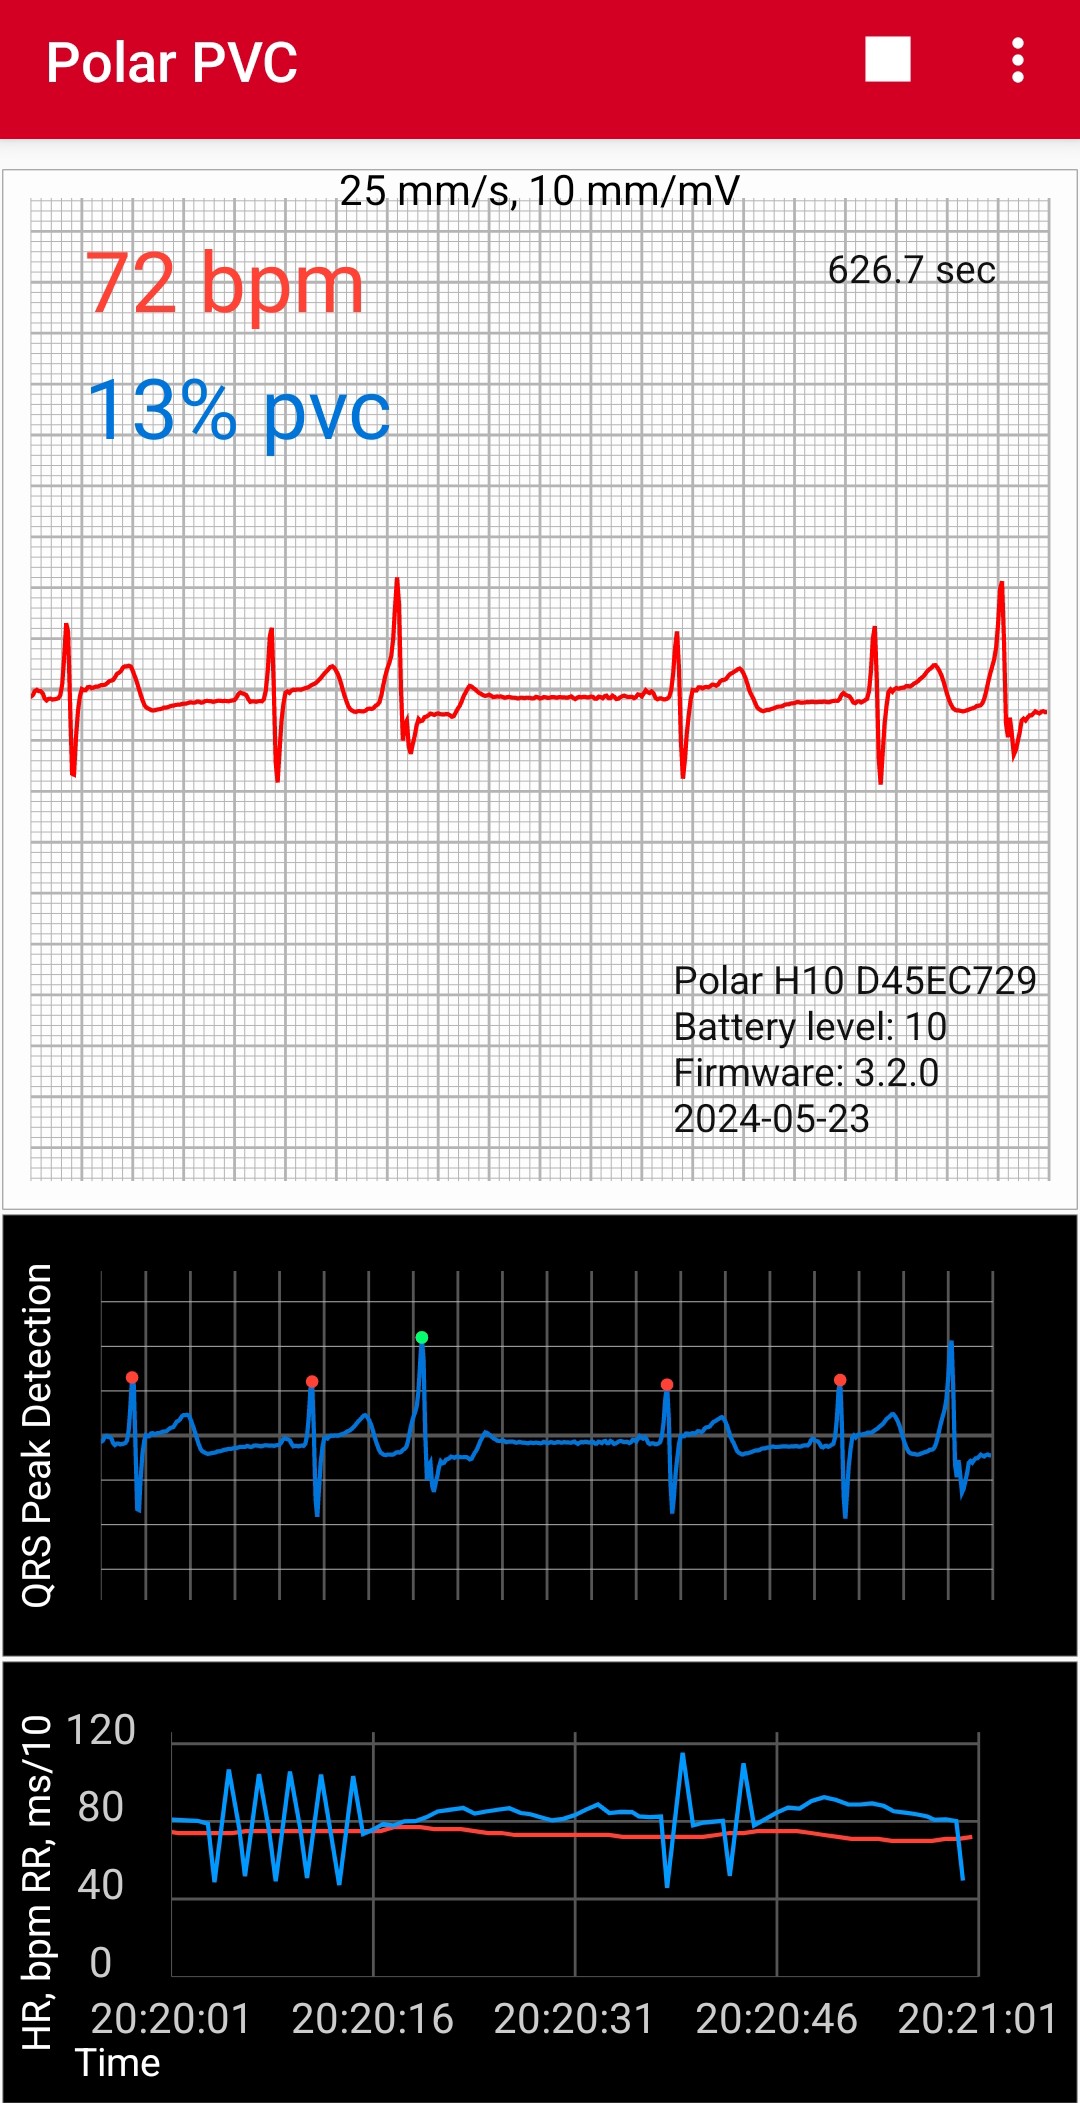
Kenneth Evans has an Android app on GitHub, KE.Net ECG, that is released under the MIT license and includes both a plot of the ECG trace as well as a peak-finding algorithm and a plot of heart rate over time. (The plots are made using the Android Plot library.) That looked perfect for my purposes, and so I forked his code, and with just a day’s work I was able to add a bit of code to classify peaks as normal or PVCs and add a read-out of PVC percentage (based on the last 100 peaks):
I wanted to further modify the app to add a plot of the PVC percentage over time, but digging into the code, it became clear that he was using an older version of the Polar SDK, and so I decided to throw it all out and start over, but then I found that I really didn’t understand what I was doing (or what he was doing in his app), and so I started over, but using a bunch of his code and following his basic design. The revised app, AndroidPolarPVC2, shows the ECG trace with peaks annotated as normal or PVC, as well as a plot of the PVC percentage and heart rate over time. It can also dump the ECG data to files, in one hour blocks.
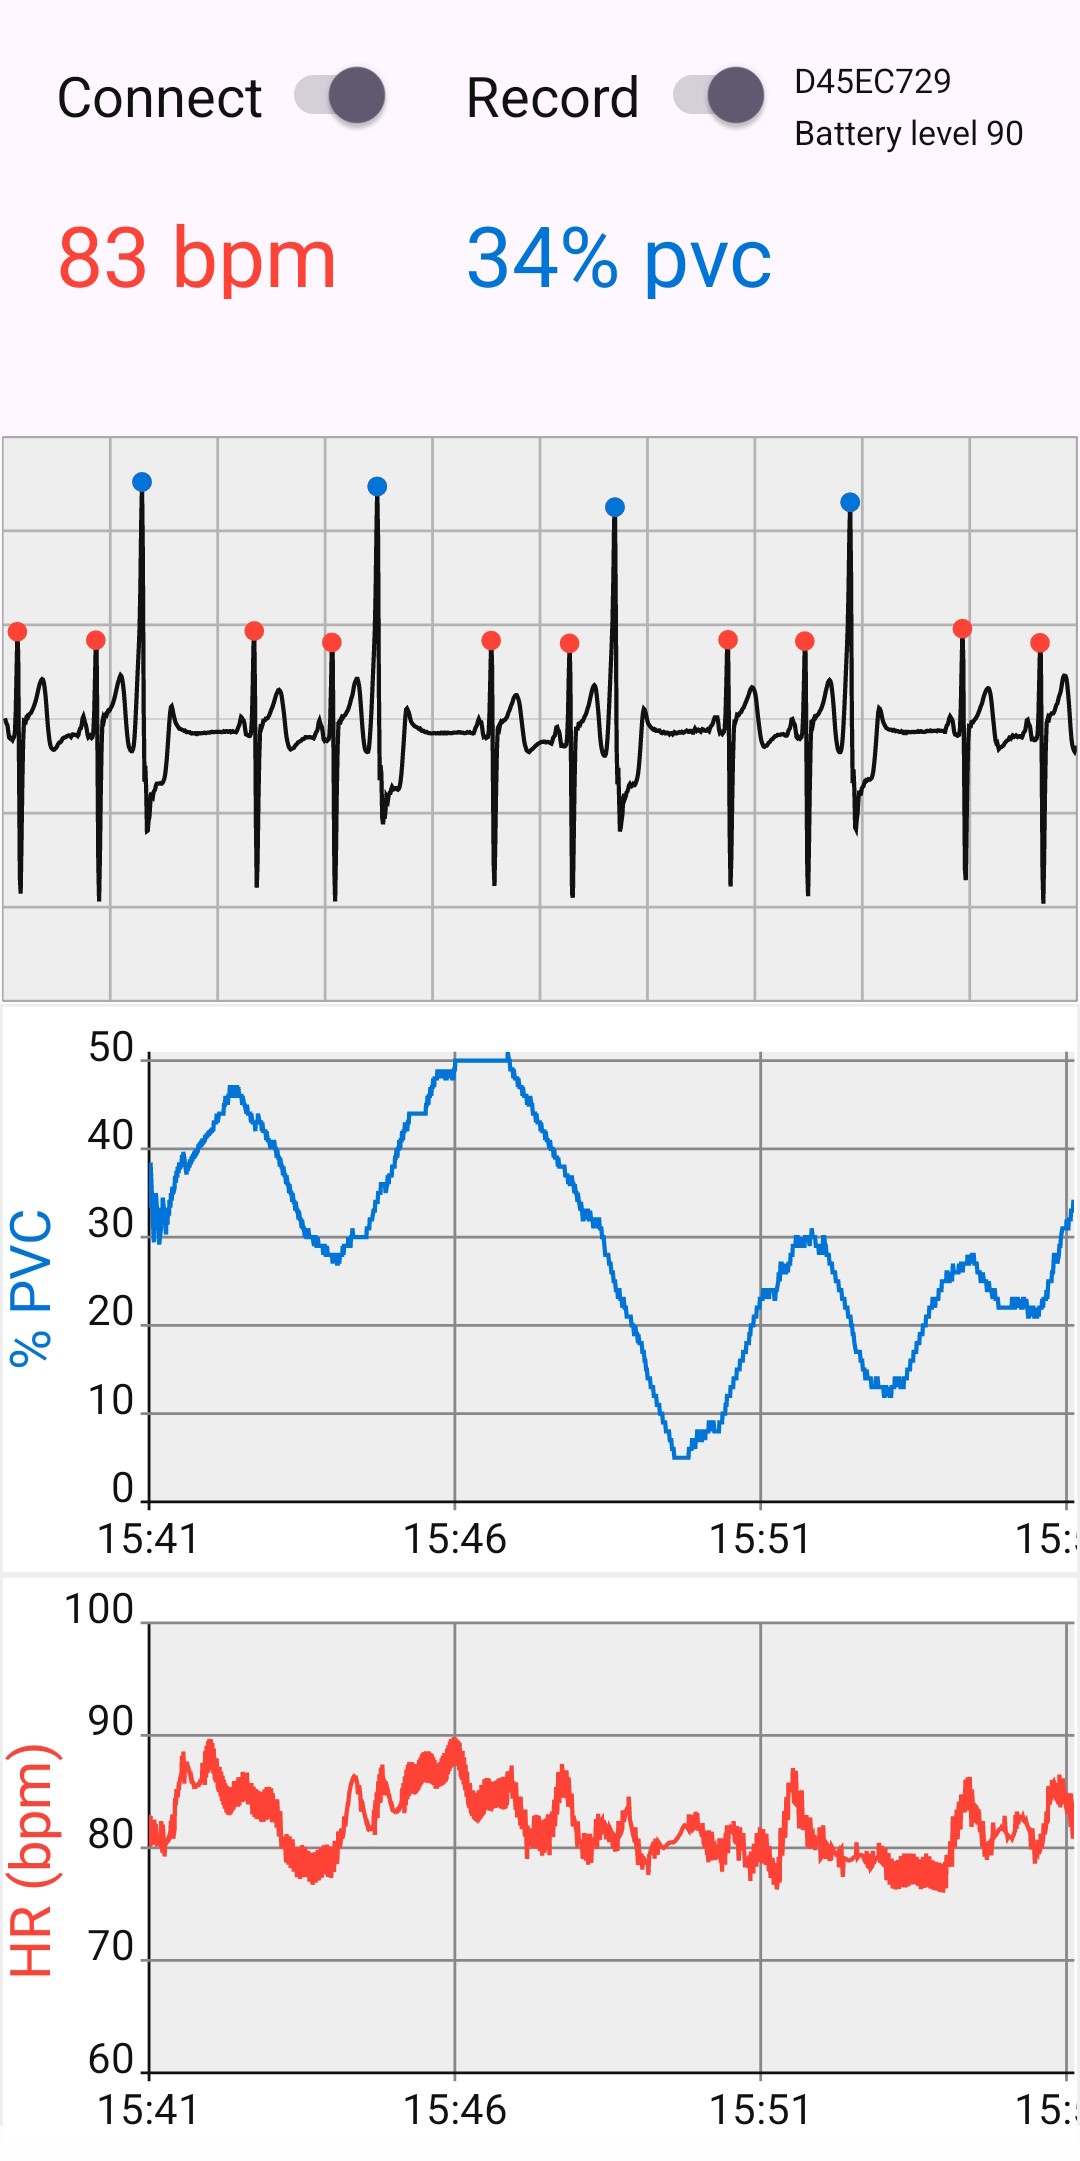
The result is exactly what I wanted, though its not nearly as robust as the ECG Logger iPhone app that I had been using. In particular, it locks up after 90 minutes. I’m not sure why that happens, and it means I can’t use it to dump 24 hours worth of data, as I’d been doing with the iPhone app. But for monitoring my PVCs during the day, it works great; I just need to re-start it every 90 minutes.
PVC ablation
When I finally met with the electrophysiologist, I wore the chest strap and brought the Android phone with the app running. I also brought a few charts to show some of the things I’d observed. But he showed little interest. He mentioned that there had been attempts to commercialize similar devices but without success, due to individual differences in the nature of the PVCs: the classification of ECG peaks as normal vs PVC would need to be redone for each patient.
Still, my R package and Android app work well for me and could be useful starting points for others.
Anyway, the electrophysiologist talked about possible medications to reduce the PVCs, but recommended catheter ablation: they thread a device up through a blood vessel from the groin into the heart, and then burn a tiny bit of tissue where the PVCs are being initiated. The success rate is high, but there is also risk of complications (for example, Wang et al. 2018 reported 2 deaths in 1231 patients). I decided to go ahead with it, and have an appointment for the procedure in two weeks time.
When did this start?
It’s not really clear what causes PVCs. And it wasn’t really clear how long it’s been happening with me. It does appear that the COVID-19 pandemic has led to an increase in cardiac arrhythmias including PVCs (for example, see Manolis et al. 2020). But when my PVCs were first identified (in April 2023) I hadn’t yet had COVID, and I was testing regularly. (I’ve had it twice since, despite continuing to be very cautious to avoid exposure.)
Recently I had a colonoscopy, in which they monitored my heart with a 6-lead ECG. The ECG was beeping the whole time due to the high frequency of PVCs. (The nurse quickly turned off the alarm, because it was annoying.) I’d had a colonoscopy at the same clinic in March, 2021, and there had been no noticeable PVCs at that time, so it seems likely that my PVCs have started since then. But still, it’s not clear why. Maybe it was due to a COVID infection that I never noticed.
I was hoping that by being able to monitor my PVCs, I might learn more about what’s causing them, but I really haven’t. I tried cutting back on caffeine: I now drink exactly one cup of coffee a day, rather than 3+, but it’s had no effect. Hopefully the ablation procedure is successful. A month from now, I’ll put on the chest strap and do a dozen squat jumps, and we’ll see how my heart responds.