I consider interactive data visualization to be the critical tool for exploration of high-dimensional data.
That’s led me to spend a good amount of time in the last few years learning some new skills (D3 and CoffeeScript) and developing some new tools, particularly the R package R/qtlcharts, which provides interactive versions of the many data visualizations in R/qtl, my long-in-development R package for mapping genetic loci (called quantitative trait loci, QTL) that underlie complex trait variation in experimental organisms.
R/qtlcharts is rough in spots, and while it works well for moderate-sized data sets, it can’t well handle truly large-scale data, as it just dumps all of the data into the file viewed by a web browser.
For large-scale data, one needs to dynamically load slices of the data based on user interactions. It seems best to have a formal database behind the scenes. But I think I’m not unusual, among statisticians, in having almost no experience working with databases. My collaborators tend to keep things in Excel. Even for quite large problems, I keep things in flat files.
So, I’ve been trying to come to understand the whole database business, and how I might use one for larger-scale data visualizations. I think I’ve finally made that last little conceptual step, where I can see what I need to do. I made a small illustration in my d3examples repository on GitHub.
Learning MongoDB
I thought mongoDB seemed like a good database to try:
-
storage of general documents seems a good match for the sort of data I work with
-
use of JSON/BSON seems a good match for D3.js
So I’ve been taking an online-course though MongoDB University – the one for Node.js developers. I should have done the more general one, using Python, but I was thinking it’d be interesting to learn Node, which is basically command-line scripting in javascript. I guess the advantage of node is that you can just write javascript. But personally I prefer to switch to the language appropriate to the task, so I’m not too hot on node. But maybe I just haven’t come to understand how best to make use of the whole callback function business.
MongoDB is not all that hard. It’s just kind of boring. The MongoDB Uni class is quite well done, though a few of the lectures were frustratingly out-of-date. I have the MongoDB book, but it’s been rough going; the class has been good for that. (The weekly deadlines have been good for motivating me to get through the dull – for me – material.)
The obvious bits with a database: how to get stuff into it and then back out of it. And then I guess deleting or changing stuff. So that’s all fine. I also learned about making indexes, so that you can more quickly get stuff out later. I don’t think my needs for these things are all that complicated. And so I think I understand those bits.
Getting the data for the data vis
The last key step that I was pondering last night: how do I, based on some user interaction with a data visualization (clicking on a point, or some such), fire off a request to the database and get the data back?
I guessed some sort of RESTful API type thing. But while I can write that down, I don’t really understand what the hell it means.
But then I thought, what I need is to use some sort of HTTP GET request. I kind of know what that means, but I don’t really understand what happens on the back end.
I’d been poking around in pymongo, the python-based mongoDB driver. (I like it much better than the ruby or node drivers.) And as part of the Mongo University class, we used express with Node to do some HTTP GET and PUSH. If I want to grab some bit of data, I could have a python script running on the back end, looking for an http request, and then based on some key that was passed, grabbing data from the database and sending it back as JSON.
So I looked around for how to do this with mongoDB, found sleepy mongoose, but that seemed like more than I wanted, and then came to bottle, which seemed like what I needed to handle the http bit. The example on the front page is just what I want: take a name from a URL and use it as input to some function, and give results back.
MongoDB/D3 illustration
The goal of all this: as part of some data visualization, the user will hover over or click a point, and this will lead to a request to the database, and then a plot of the data that comes back.
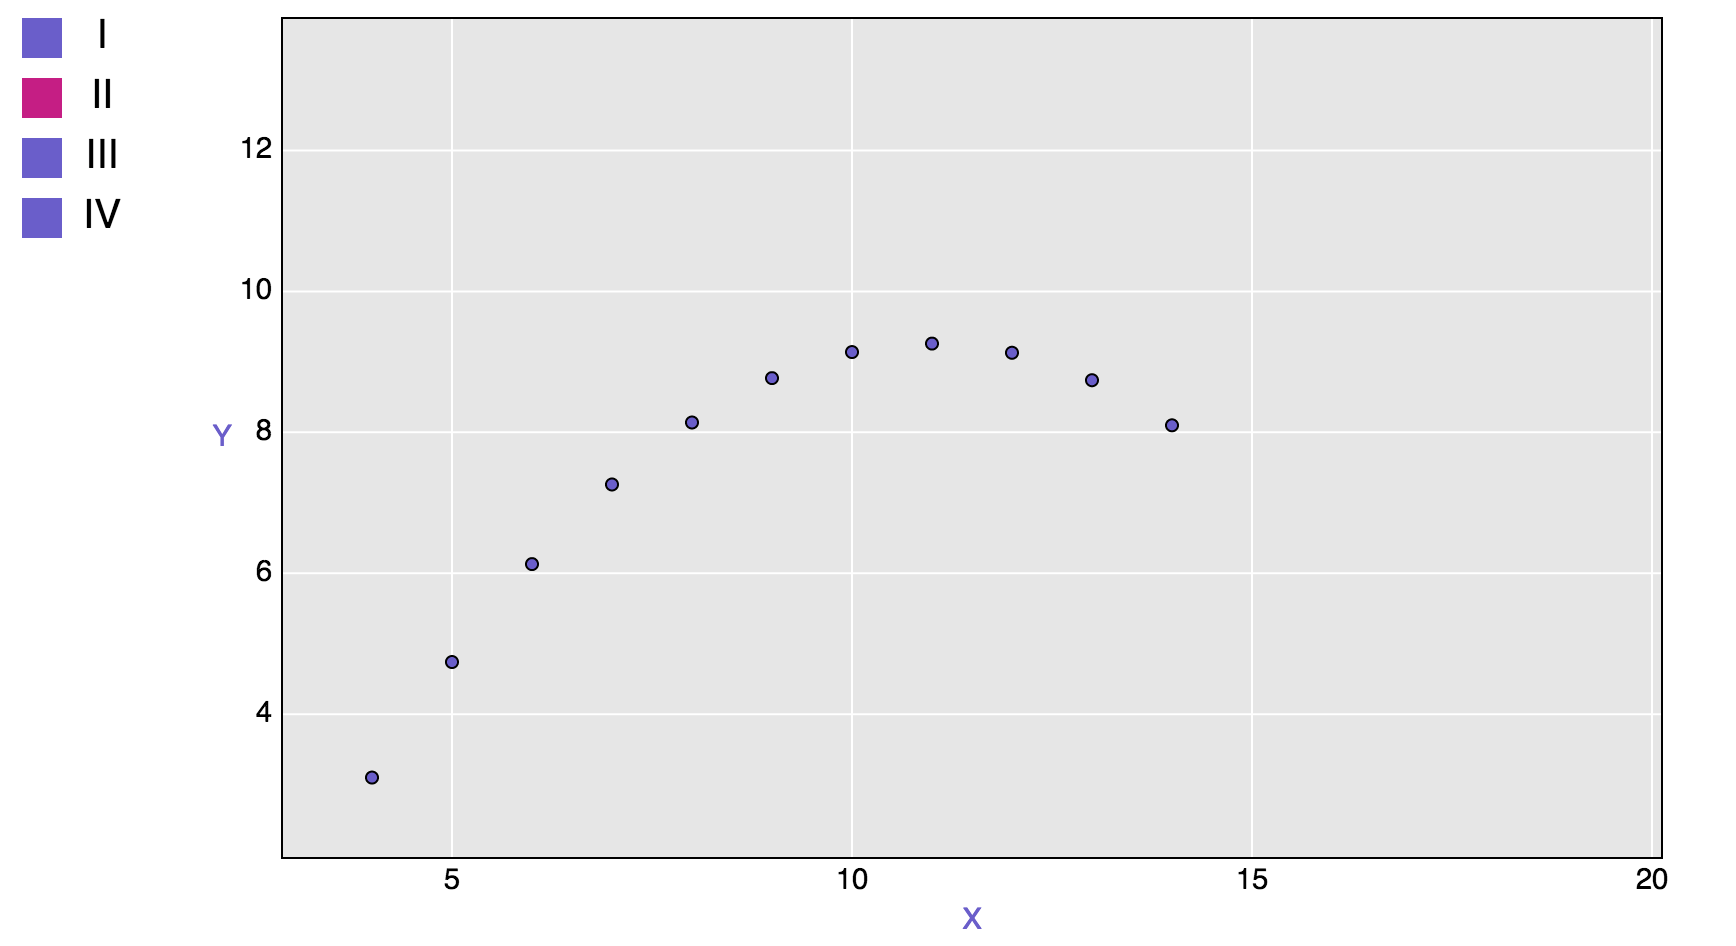
It seemed like a simple test case would be to use the data for Anscombe’s quartet. Put the four series into a MongoDB database, and then have four buttons that, when clicked, cause a request to the database to grab the corresponding series, which is then plotted.
So first I wrote an R script to grab the data from the table on the wikipedia page and write it to a JSON file. I’m sure there was an easier way to get the data in a suitable form, but I was really procrastinating from writing a paper at this point, so I thought I’d test my web scraping skill in a simple case.
I then wrote a python script that reads in the JSON file and inserts the data into a mongoDB database. You make a database connection with pymongo.MongoClient() and insert the documents with the insert_one() method to a collection. I later added an index with create_index(); pretty silly here, but for large problems it would be useful.
So, the data’s in the database. How to get it back out? I wrote a second python script (just 8 lines, really), that uses bottle to create a server that connects a URL to a function call. The function then uses pymongo to find the corresponding document and send it back as JSON. One tricky bit that needed some extra googling was getting the browser to allow the request.
The D3 code (in coffeescript) is pretty standard. On clicking a button, I call d3.json with the appropriate URL that corresponds to a request from the python script; the data come back as JSON, and are then passed to a callback function to make the actual plot.
This MongoDB/D3 illustration is a toy example, but it represents an important step for me, personally. I’m rather proud of it.
I don’t actually have a live example of this. That’s the next thing: how to have this running on a proper web server, rather than just locally.